GAN Disentanglement: Unraveling the Complexities of Generative Networks
Welcome to our project, an in-depth exploration of GAN disentanglement led by Katharina Scheucher and Christian Stippel. As part of the Visualization 2 university course, this web application aims to elucidate the intricate mechanics of Generative Adversarial Networks (GANs) and the fascinating realm of disentanglement.
GANs, robust machine learning models, have gained significant attention for their ability to generate realistic synthetic data. While powerful, the understanding of the latent space that controls the output remains a complex challenge. This project focuses on this area of GANs, often referred to as 'disentanglement', which seeks to separate and independently control the various factors of variation within the model's output.
At its core, we focused on implementing the content of our selected paper 'Interactively Assessing Disentanglement in GANs' [1], harnessing state-of-the-art frontend technologies such as React, Next.js, and MUI. Trom there, we developed our own unique concept.
Demo
Overview Implementation
The paper explores the concept of disentanglement in Generative Adversarial Networks (GANs). Disentanglement refers to the ability to separate and control different factors of variation in generated data. In this context, we focus on faces and their attributes such as "Blond Hair", "Young", "Male‘, etc.. We implemented their multi-view visualization tool, including the following main views:
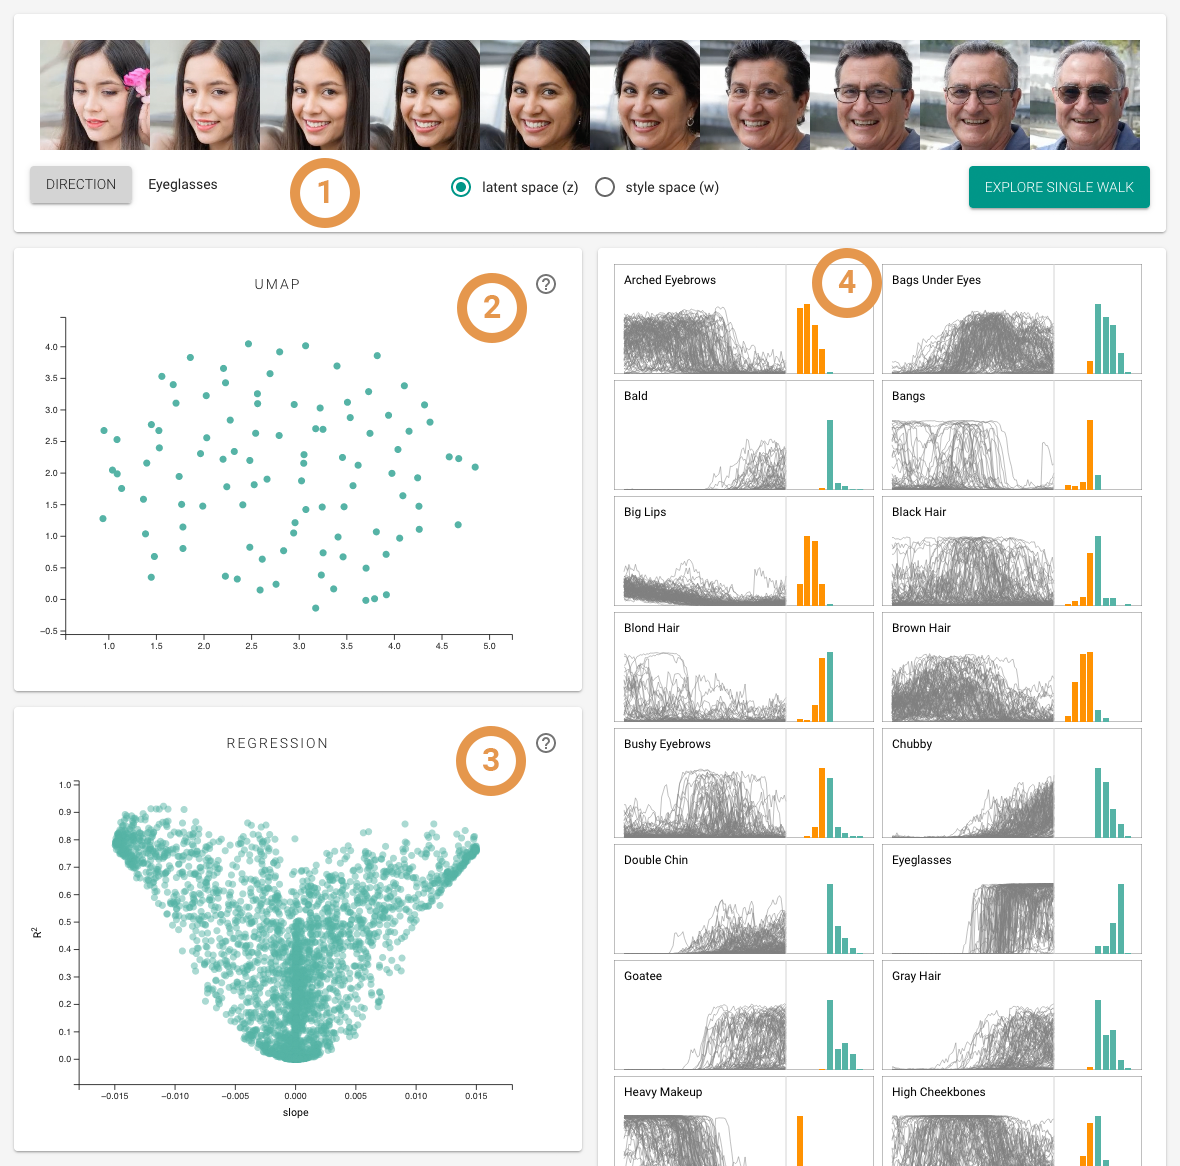
1. Walk Display
With 30 different facial attributes to choose from, users can select their desired direction and witness the data transform. The original latent code is positioned in the middle. Moving to the left represents the opposite direction, while moving to the right shows the selected direction. To enhance the exploration process, users have the option to inspect either the latent space z or the style space w. The latent space z represents the latent code before it undergoes the mapping network in a generative network. On the other hand, the style space w reflects the attributes after the mapping network has been applied. Through this feature, users can observe the differences and complexities between the two spaces. It's worth noting that the style attributes within the w space tend to be less entangled compared to the z space, offering further insights into the disentanglement process.
2. UMAP Projection
The UMap-projection acts as a window for selecting walks in terms of similarity in their activations. This representation of the walks is decoupled from the information that regression provides, and enables cross-examination of walks in two different representation.
3. Regression Plot
In this scatterplot, the points represent combinations of walks and their attribute-specific linear regression models. The x-axis shows the model's slope, while the y-axis represents its R2 coefficient. If the points cluster around the centerline, it indicates that the direction does not reflect any of the attributes. Conversely, points spreading out towards the upper left/right suggest consistent decrease/increase in certain attributes.
4. Attribute View
The attribute view allows users to inspect the changes of each attribute in the chosen direction. The line chart displays the changing value of the attribute throughout the walk, enabling users to observe patterns and trends over time. The histogram in the attribute view categorizes the slopes of attribute changes into bins, with negative slopes shown in orange on the left and positive slopes displayed in green on the right. The attribute view allows users to transfer the selection from the UMAP visualization, enabling them to focus on fewer walks or even a single walk for a more detailed inspection and analysis.
Detail Implementation
Our own concept is centered around examining the detailed changes of individual walks, complementing the overview provided in the paper. To facilitate access and exploration, users have two convenient options to utilize our tool. They can begin their analysis by accessing the landing page, where a random walk is automatically loaded for immediate inspection. Alternatively, users can access the tool through the paper implementation and manually select a specific walk they wish to explore in detail. To streamline the user experience and focus on essential information, we have designed three main views within the tool.
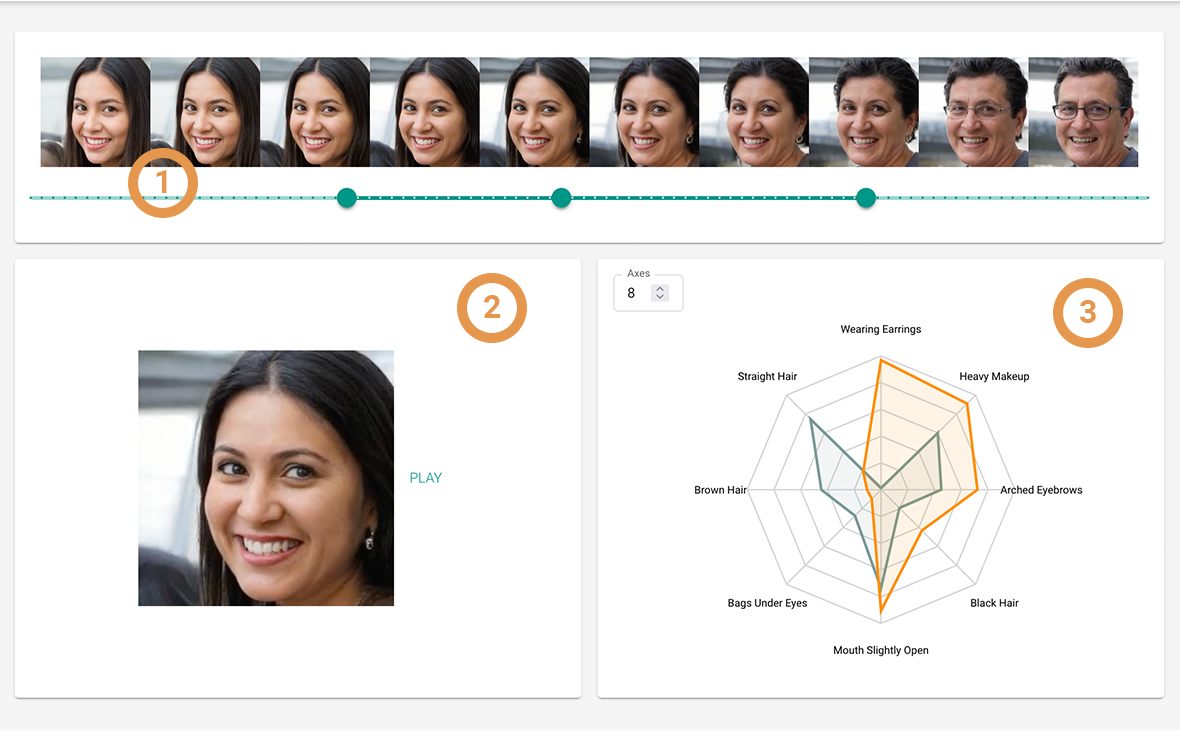
1. Walk Display
In our enhanced Walk Display feature, similar to the previous display, users can view a random or previously selected walk. However, this time, we have implemented a slider with three thumbs to provide greater control. The first thumb allows users to select the starting point of the observed section, which corresponds to the green polyline in the radar chart (3). The second thumb indicates the current location within the walk, and the last thumb determines the end of the sequence. As users adjust these thumbs, the walk dynamically adapts to display the face at the start, end, and intermediate positions accordingly.
2. Video
The video component offers an animated visualization of the face's changes throughout the selected sequence. The second set of slider thumbs corresponds to the visible frames in the video, moving synchronously as the video plays. This interactive feature enables users to seamlessly navigate through the sequence and observe the dynamic transformations of the face on the image and in the radar chart.
3. Radar Chart
Lastly, the radar charts provide a visual representation of the changing attribute values. Considering the total 30 attributes, we have organized them by relevance, displaying the attributes with the most significant absolute changes first. Users also have the option to select the number of axes. The green polyline corresponds to the values at the first thumb position, while the orange polyline corresponds to the second thumb position. As the video plays, the values of the radar chart dynamically adjust to reflect the attribute changes throughout the sequence.
Data Generation
StyleGAN is a cutting-edge Generative Adversarial Network (GAN) developed by Nvidia, designed to generate new, synthetic images that mimic the appearance of real photos. Its architecture introduces a mapping network, transforming an input latent vector 'z' into a style vector 'w', and a style-based generator which crafts new images using 'w'. The two distinctive spaces in StyleGAN are the Latent Space 'z' and the Style Space 'w'. The Latent Space 'z' is the initial input space, where each point can be thought of as a seed for image generation. The Style Space 'w', on the other hand, is an intermediate space, achieved by passing 'z' through the mapping network. The transformation from 'z' to 'w' helps disentangle the features of generated images, making it possible to manipulate specific features without affecting others.
1. Image Generation
We begin our data generation process by producing 500,000 images using StyleGAN2 models at a resolution of 256x256 pixels. During this stage, each image's 'z' vector, 'w' vector, and the image itself are saved for further use. This results in an extensive gallery of synthetic images, each associated with their respective latent vectors.
2. Attribute Classification
While generating images, we also train 30 MobileNet models on the CelebA dataset. This dataset is rich in diverse celebrity faces, annotated with various facial attributes. Once trained, these MobileNet models classify the 500,000 generated images, providing a categorical understanding of the attributes present in each image.
3. Support Vector Machines Training
Our next step involves training Support Vector Machines (SVMs) in both the latent space 'z' and the style space 'w'. The trained SVMs identify decision boundaries separating different classes within the spaces. We then retain the coefficients from the SVMs—these act as normals to the decision boundaries, providing us with a direction for traversing the latent spaces.
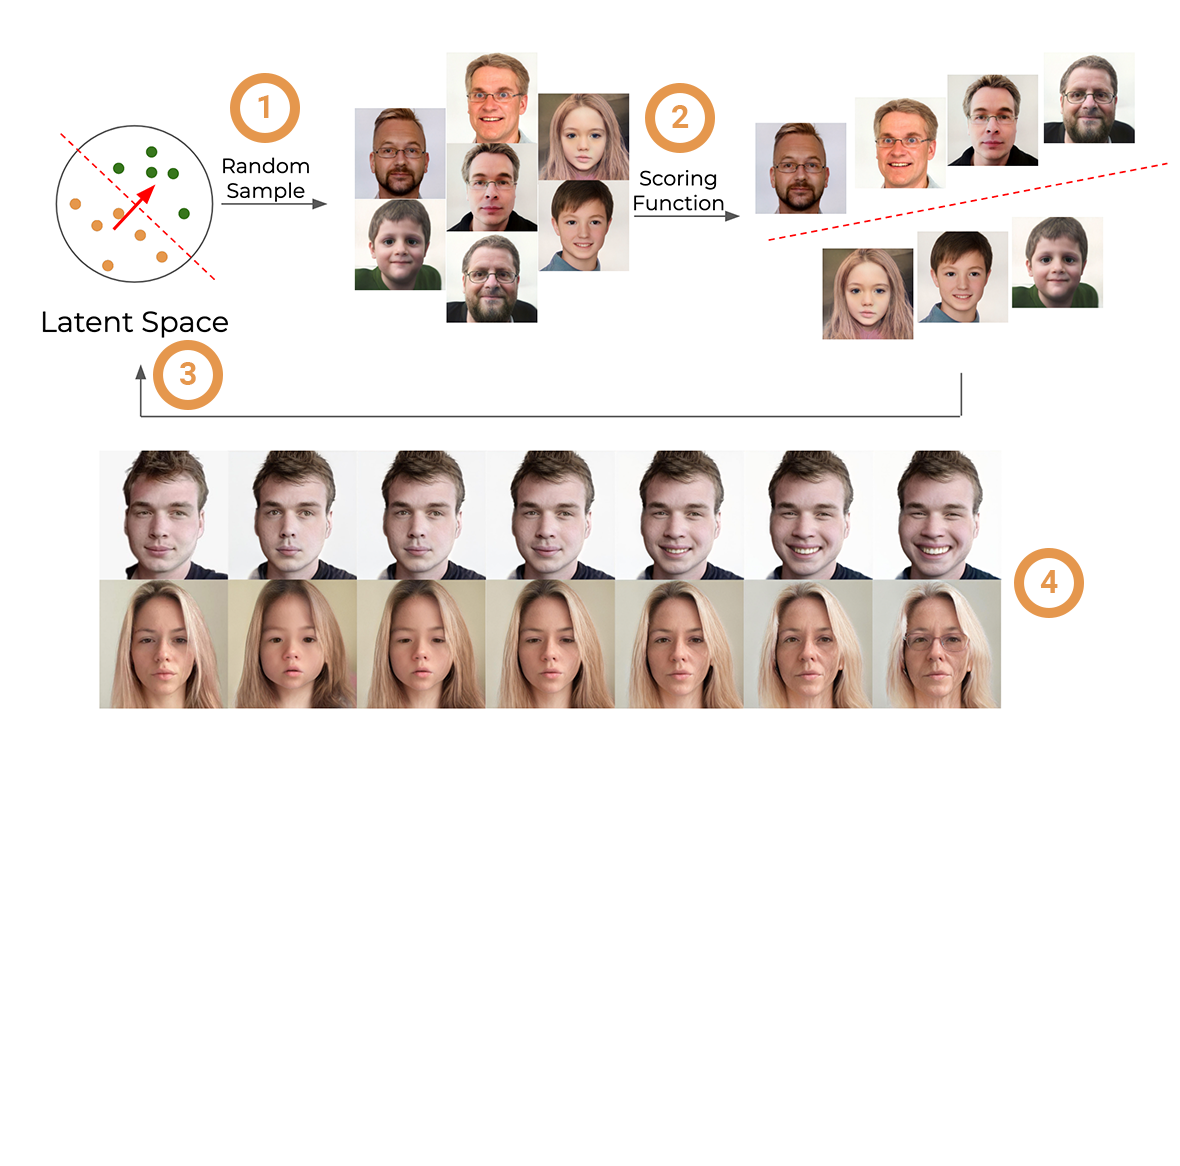
4. Walks Generation and Classification
We embark on our final step: generating "walks" through the latent spaces. Each walk begins from a random point in the space, and moves in a direction defined by the SVM normals. This movement generates a sequence of images that vary along the attribute associated with that particular direction. The images created during these walks are classified with the trained MobileNet models, ensuring that they represent changes in the anticipated attribute.
References
[1] Jeong, Sangwon, Shusen Liu, and Matthew Berger. "Interactively Assessing Disentanglement in GANs." Computer Graphics Forum. Vol. 41. No. 3. 2022.